
Metrics tell you what's broken. Logs tell you what happened. Traces tell you why - they show the full journey of a request across services. In this post, I'll cover how distributed tracing works in my homelab, from Istio's automatic instrumentation to Tempo's storage.
The Tracing Stack
My tracing setup has three layers:
- Istio: Automatically instruments all service-to-service traffic
- OpenTelemetry (OTLP): The protocol that carries trace data
- Tempo: Stores and indexes traces for querying
No Jaeger, no Zipkin - just OTLP and Tempo. Modern and simple.

Istio's Automatic Instrumentation
This is the magic of service mesh tracing. Istio's proxies (Envoy sidecars or ztunnel in ambient mode) automatically:
- Generate trace spans for every request
- Propagate trace context between services
- Export spans via OTLP
I don't need to modify application code. Every HTTP request through the mesh gets traced.
Configuring the OTLP Provider
Istiod needs to know where to send traces. This is configured via extension providers:
# In istiod Helm values
meshConfig:
  extensionProviders:
    - name: "otel"
      opentelemetry:
        port: 4317
        service: "k8s-monitoring-alloy-receiver.monitoring.svc.cluster.local"
  defaultProviders:
    tracing:
      - "otel"
Key points:
- Port 4317: OTLP gRPC (more efficient than HTTP)
- Service: Points to the Alloy receiver from k8s-monitoring
- defaultProviders: Makes this the default for all namespaces
Enabling Tracing Per Namespace
Even with a default provider, I use Telemetry resources for explicit control:
apiVersion: telemetry.istio.io/v1alpha1
kind: Telemetry
metadata:
  name: tracing-default
  namespace: istio-system
spec:
  tracing:
    - providers:
        - name: otel
      customTags:
        cluster_name:
          literal:
            value: "homelab"
        environment:
          literal:
            value: "development"
The customTags add context to every span. When I eventually have multiple clusters, I'll know which one a trace came from.
Sampling: 100% for Homelab
In production, you'd sample a percentage of traces to reduce volume. My homelab uses 100%:
meshConfig:
  defaultConfig:
    tracing:
      sampling: 100.0
Why? Because:
- Traffic volume is low (it's a homelab)
- I want to see every request while debugging
- Storage is cheap (1Gi for Tempo is plenty)
For production, you'd use something like 1% or probabilistic sampling based on trace characteristics.
The OTLP Receiver
Traces flow through the Alloy receiver before reaching Tempo:
# k8s-monitoring Helm values
applicationObservability:
  enabled: true
  destinations: ["local-otlp"]
  receivers:
    otlp:
      grpc:
        enabled: true
        endpoint: 0.0.0.0:4317
      http:
        enabled: true
        endpoint: 0.0.0.0:4318
This creates a service at k8s-monitoring-alloy-receiver.monitoring.svc.cluster.local that accepts both gRPC and HTTP OTLP.
Why go through Alloy instead of directly to Tempo? Flexibility. Alloy can:
- Filter or transform spans
- Add additional attributes
- Buffer during Tempo downtime
- Route to multiple backends if needed
Querying Traces in Grafana
Grafana connects to Tempo natively. In the Explore view:
- Select the Tempo datasource
- Search by service name, duration, or status
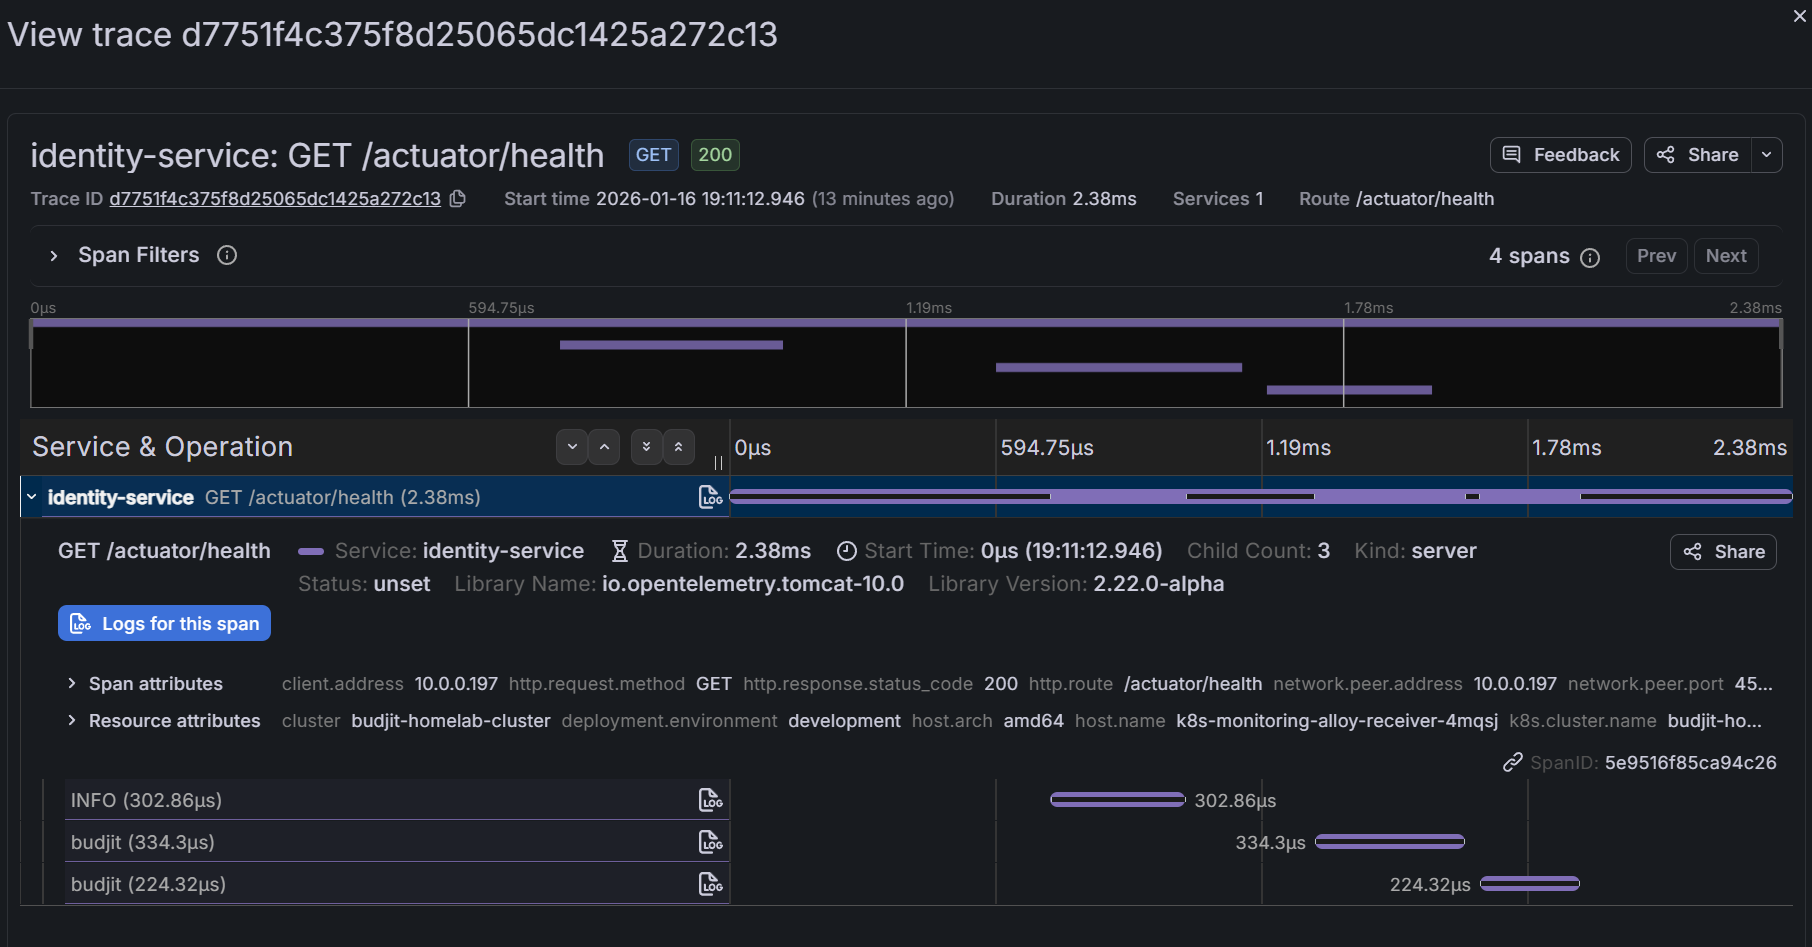
- Click into a trace to see the waterfall view
Common queries:
{status=error}- Find failed requests{service.name="api-gateway"} && duration > 500ms- Slow gateway requests{http.status_code=500}- Server errors
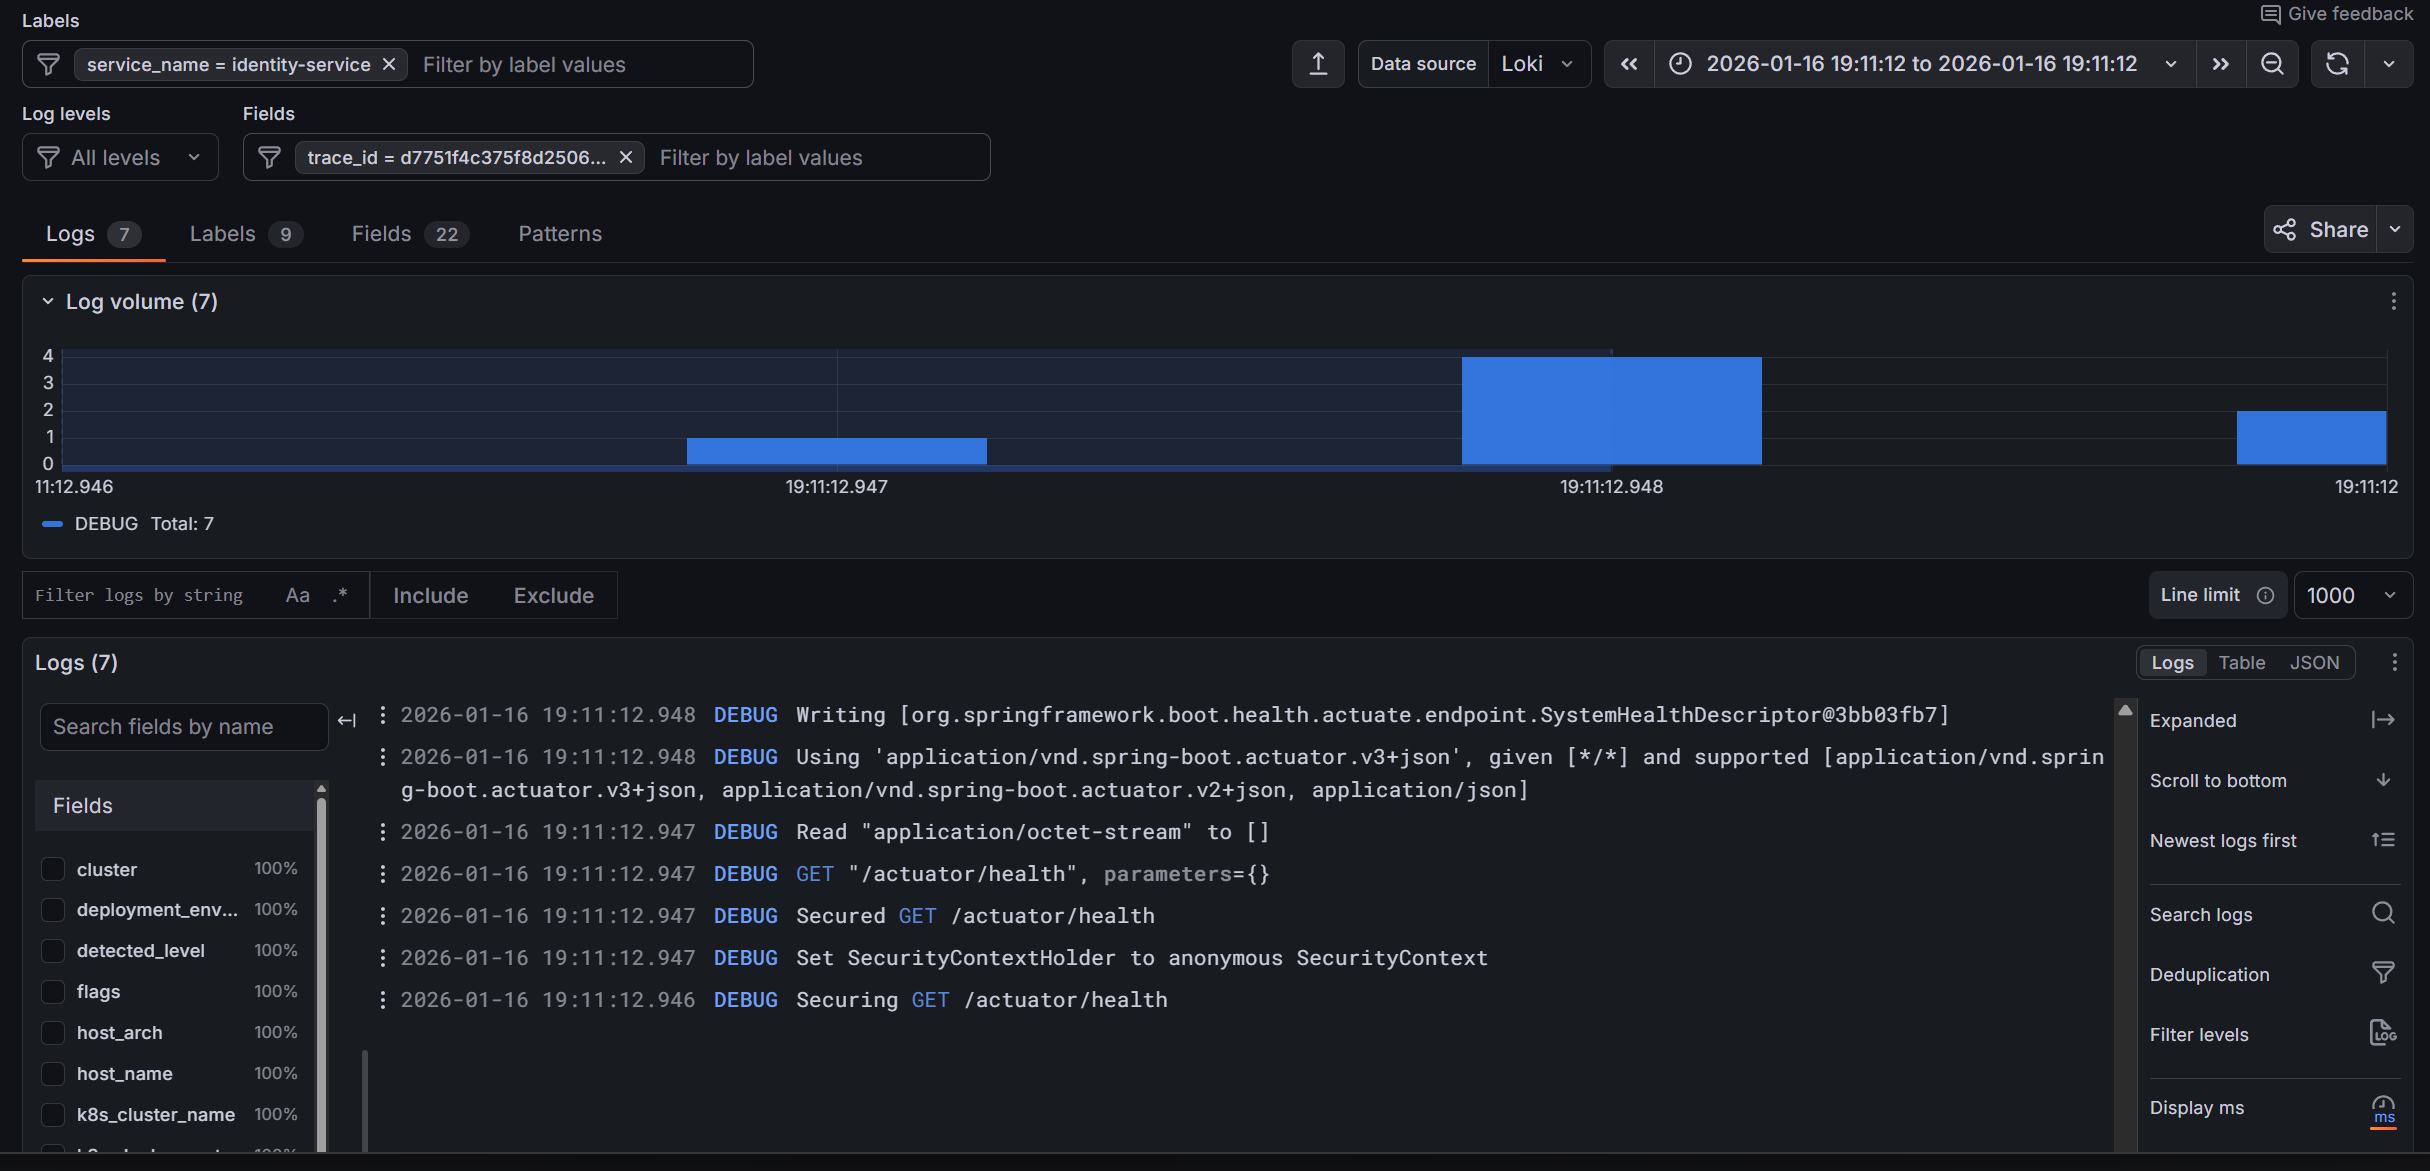
Correlating Traces with Logs
The real power is correlation. In Grafana:
- View a trace
- See the exact time range
- Click "Logs for this span" to see logs from that service during that time
This requires trace IDs in your logs. Istio's proxy logs include trace context, and well-instrumented applications will too.
Ambient Mode Considerations
I run Istio in ambient mode (no sidecars). Tracing still works, but there's a nuance:
Sidecar mode: Every pod has an Envoy proxy. Traces show each hop clearly.
Ambient mode: ztunnel handles L4 mTLS, waypoint proxies handle L7 (if configured). Traces show ztunnel spans rather than per-pod Envoy spans.
For my homelab, this is fine. The traces still show the service-to-service flow. I just see fewer internal spans per request.
Adding Application Traces
Istio traces mesh traffic automatically. But what about internal application logic? For that, you need instrumentation.
Applications can send traces directly to the OTLP receiver:
# Application environment variables
env:
  - name: OTEL_EXPORTER_OTLP_ENDPOINT
    value: "http://k8s-monitoring-alloy-receiver.monitoring.svc.cluster.local:4318"
  - name: OTEL_SERVICE_NAME
    value: "my-application"
  - name: OTEL_RESOURCE_ATTRIBUTES
    value: "service.namespace=my-namespace"
Then use an OpenTelemetry SDK in your code to create spans for important operations (database queries, external API calls, etc.).
Trace Storage and Retention
Tempo stores traces in /data/tempo with a 1Gi PVC:
volumeMounts:
  - name: tempo-data
    mountPath: /data/tempo
The otel-lgtm image uses Tempo's default retention settings. For a homelab, this typically means a few days of traces before old data is deleted.
If you need longer retention, either increase the PVC size or configure Tempo's compaction and retention settings explicitly.
What I've Learned
1. OTLP everywhere simplifies everything. One protocol for metrics, logs, and traces. No more Zipkin vs Jaeger vs whatever.
2. 100% sampling is fine for low traffic. Don't prematurely optimise. Sample everything until you can't.
3. Ambient mode traces differently. Expect ztunnel spans instead of sidecar spans. The information is still there, just structured differently.
4. Correlation is the killer feature. Traces alone are useful. Traces linked to logs and metrics are powerful.
5. Automatic instrumentation has limits. Istio traces mesh traffic. Internal application logic needs explicit instrumentation.
What's Next
We've got metrics flowing and traces capturing. But who wants to stare at dashboards all day? In Part 4, I'll cover alerting - Grafana's unified alerting, Crossplane-managed rule groups, and Discord notifications so my phone buzzes when something breaks.
This is Part 3 of a 4-part series on homelab observability.