
Dashboards are for humans. Alerts are for when humans aren't looking. In this final part of my observability series, I'll cover how I manage alerts as code using Crossplane, route them to Discord, and which alerts actually matter for a homelab.
Why Grafana Unified Alerting?
Traditional Prometheus alerting uses PrometheusRules that trigger AlertManager. It works, but:
- AlertManager is another component to deploy and configure
- Alert rules live separately from visualisations
- Silences and routing require AlertManager config changes
Grafana's Unified Alerting brings everything together:
- Alert rules in the same place as dashboards
- Built-in contact points (email, Slack, Discord, etc.)
- Alert state history stored in Loki
- No separate AlertManager deployment
For a homelab, less moving parts = better.

Alerts as Code with Crossplane
I don't click through Grafana's UI to create alerts. Instead, I manage everything as Kubernetes resources using Crossplane's Grafana provider.
# Install the Grafana provider
apiVersion: pkg.crossplane.io/v1
kind: Provider
metadata:
  name: provider-grafana
spec:
  package: xpkg.upbound.io/grafana/provider-grafana:v0.34.0
This gives me CRDs for Grafana resources:
RuleGroup- Alert rulesContactPoint- Notification channelsNotificationPolicy- Alert routing
All GitOps-managed via ArgoCD.
The Alert Folder
Grafana organises alerts into folders. I create one for all homelab alerts:
apiVersion: oss.grafana.crossplane.io/v1alpha1
kind: Folder
metadata:
  name: homelab-alerts
spec:
  forProvider:
    title: "Homelab Alerts"
    uid: homelab-alerts
  providerConfigRef:
    name: grafana-config
Defining Alert Rules
Alert rules are defined as RuleGroups. Here's my infrastructure availability alerts:
apiVersion: alerting.grafana.crossplane.io/v1alpha1
kind: RuleGroup
metadata:
  name: infrastructure-availability
  namespace: monitoring
spec:
  forProvider:
    name: "Infrastructure Availability"
    folderRef:
      name: homelab-alerts
    intervalSeconds: 60
    rule:
      - name: "Docker Registry Unavailable"
        condition: C
        data:
          - refId: A
            relativeTimeRange:
              from: 300
              to: 0
            datasourceUid: prometheus
            model:
              expr: probe_success{job="probe/monitoring/registry-external-probe"}
              instant: true
          - refId: C
            datasourceUid: "__expr__"
            model:
              type: threshold
              expression: A
              conditions:
                - evaluator:
                    type: lt
                    params: [1]
        for: 2m
        labels:
          severity: critical
          component: registry
          team: homelab
        annotations:
          summary: "Docker Registry is unavailable"
          description: "The registry probe has been failing for 2 minutes"
          runbook_url: "https://docs.example.com/runbooks/registry"
Let's break this down:
- intervalSeconds: 60: Evaluate every minute
- condition: C: The alert fires when expression C is true
- refId A: Queries the
probe_successmetric - refId C: Threshold condition - fires when A < 1 (probe failed)
- for: 2m: Must be failing for 2 minutes before alerting
- labels: Used for routing and grouping
- annotations: Human-readable context
My Alert Categories
I organise alerts into groups:
1. Infrastructure Availability (Blackbox Probes)
# Fires when external probes fail
- DockerRegistryUnavailable (critical, 2m)
- CoreInfrastructureUnavailable (critical, 3m)
- StorageInfrastructureUnavailable (warning, 3m)
- DatabaseInfrastructureUnavailable (warning, 3m)
These use the blackbox exporter's probe_success metric.
2. Kubernetes Health
# Fires for pod/PVC issues
- InfrastructurePodsNotReady (warning, 10m)
- CriticalPodsNotReady (warning, 5m)
- PVCHighUsage (warning, 10m)
Using kube-state-metrics data from k8s-monitoring.
3. Istio Mesh Health
# Fires for service mesh issues
- IstioControlPlaneNoProxies (critical, 5m)
- IstioEndpointsNotReady (warning, 10m)
Key for catching mesh configuration issues.
4. Ztunnel Certificate Issues
# The bane of my existence
- ZtunnelCertificateExpired (critical, 2m)
- ZtunnelPodAgeWarning (warning, 14 days)
That second one alerts when ztunnel pods are getting old - a reminder to restart before certificates have issues.
5. Log-Based Alerts
# Fires on error patterns in logs
- ErrorsDetectedInLogs (info, 30s)
- CriticalInfrastructureErrors (critical, 1m)
Using Loki LogQL queries to detect error patterns:
count_over_time({namespace=~"istio-system|argocd|monitoring"}
  |~ "(?i)panic|fatal|critical|emergency" [5m]) > 0
Discord Integration
I send alerts to Discord because it's free, I already use it, and mobile notifications work well.
Step 1: Create the Webhook
In Discord: Server Settings → Integrations → Webhooks → New Webhook
Copy the webhook URL. Store it in Infisical.
Step 2: ExternalSecret for the Webhook
apiVersion: external-secrets.io/v1beta1
kind: ExternalSecret
metadata:
  name: discord-webhook
  namespace: monitoring
spec:
  refreshInterval: 15m
  secretStoreRef:
    name: infisical-store
    kind: ClusterSecretStore
  target:
    name: discord-webhook
  data:
    - secretKey: url
      remoteRef:
        key: /lgtm/alerts/discord/DISCORD_WEBHOOK_URL
Step 3: ContactPoint CRD
apiVersion: alerting.grafana.crossplane.io/v1alpha1
kind: ContactPoint
metadata:
  name: discord-homelab-alerts
  namespace: monitoring
spec:
  forProvider:
    name: "discord-homelab-alerts"
    discord:
      - urlSecretRef:
          name: discord-webhook
          key: url
          namespace: monitoring
        disableResolveMessage: false
        useDiscordUsername: false
        message: |
          **HOMELAB ALERT**

          **Alert:** {{ .GroupLabels.alertname }}
          **Status:** {{ .Status }}
          **Severity:** {{ .GroupLabels.severity }}
          **Component:** {{ .GroupLabels.component }}

          **Summary:** {{ .Annotations.summary }}
          **Description:** {{ .Annotations.description }}

          **Runbook:** {{ .Annotations.runbook_url }}
The disableResolveMessage: false means I also get notified when alerts resolve. Nice for knowing when things are back to normal.
Step 4: NotificationPolicy
Routes alerts to the contact point:
apiVersion: alerting.grafana.crossplane.io/v1alpha1
kind: NotificationPolicy
metadata:
  name: homelab-routing
  namespace: monitoring
spec:
  forProvider:
    contactPoint: discord-homelab-alerts
    groupBy:
      - grafana_folder
      - alertname
    groupWait: 10s
    groupInterval: 5m
    repeatInterval: 12h
    policy:
      # Route by folder
      - matcher:
          - label: grafana_folder
            match: "="
            value: "Homelab Alerts"
        contactPoint: discord-homelab-alerts
      # Route by team label
      - matcher:
          - label: team
            match: "="
            value: "homelab"
        contactPoint: discord-homelab-alerts
      # Route by severity
      - matcher:
          - label: severity
            match: "=~"
            value: "critical|warning|info"
        contactPoint: discord-homelab-alerts
Key settings:
- groupBy: Combine related alerts into one notification
- groupWait: 10s: Wait 10 seconds for related alerts before sending
- repeatInterval: 12h: Don't spam the same alert constantly
Alert State History in Loki
Grafana stores alert state changes in Loki:
# Grafana environment variables
GF_UNIFIED_ALERTING_STATE_HISTORY_ENABLED: "true"
GF_UNIFIED_ALERTING_STATE_HISTORY_BACKEND: "loki"
GF_UNIFIED_ALERTING_STATE_HISTORY_LOKI_REMOTE_URL: "http://127.0.0.1:3100"
This means I can query alert history like any other logs:
{alertname="DockerRegistryUnavailable"} | json | state = "Alerting"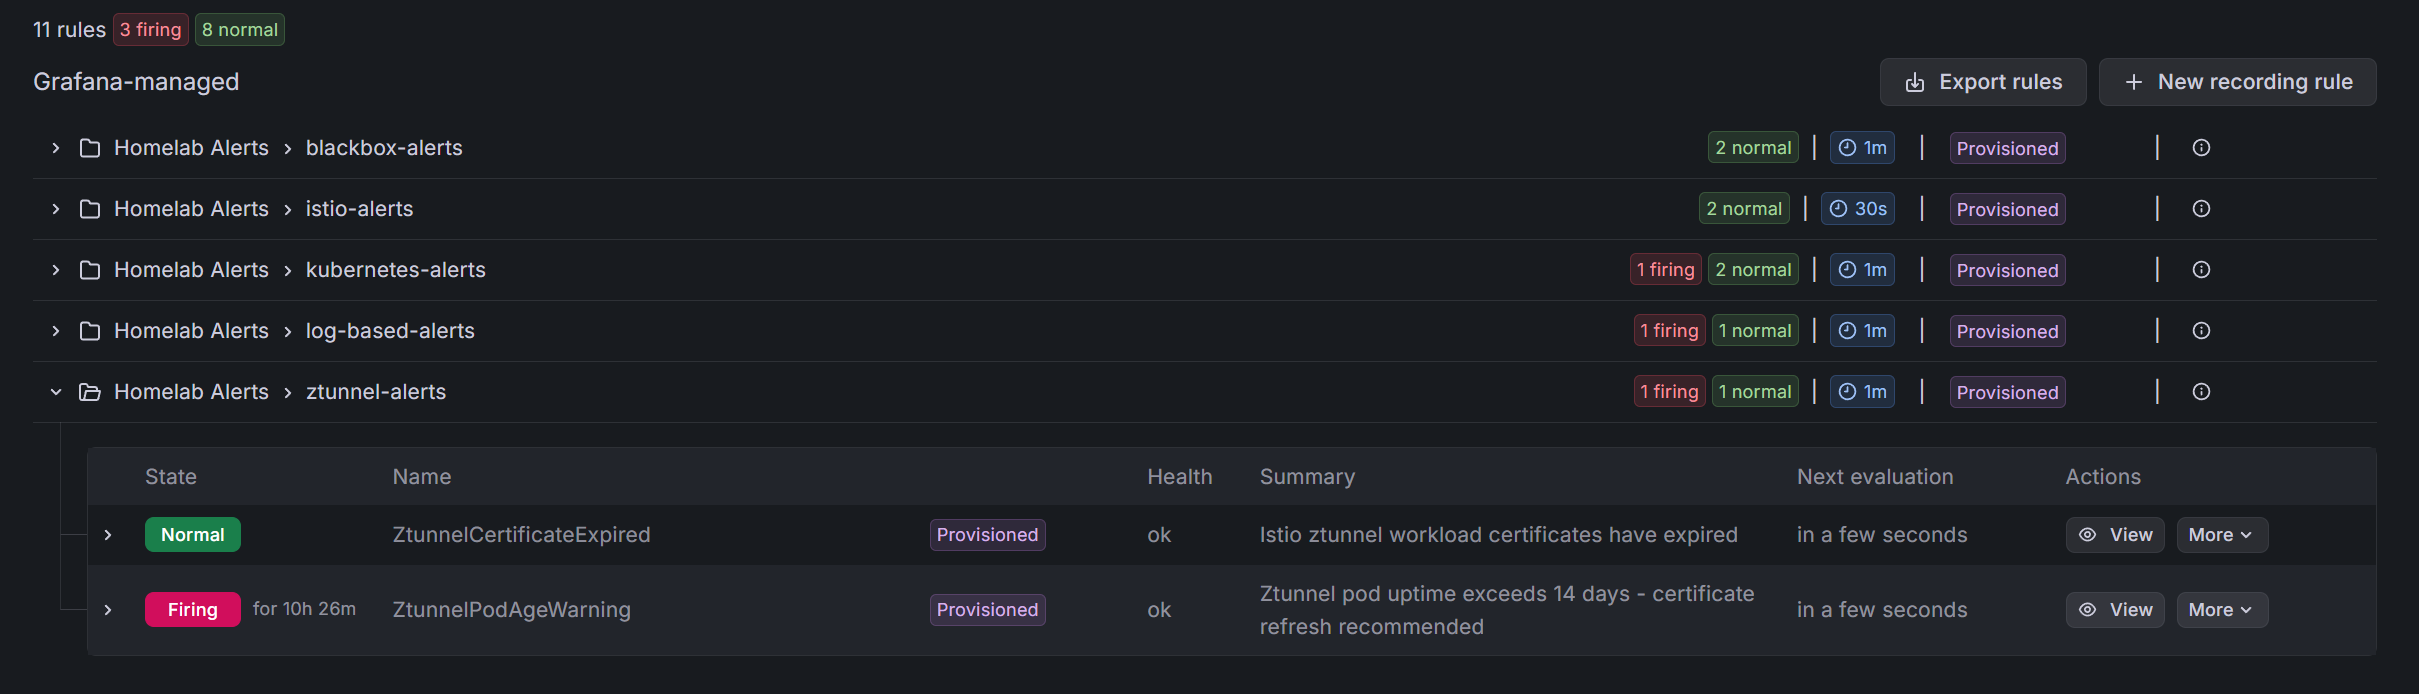
Useful for:
- How often does this alert fire?
- How long do outages typically last?
- Correlation with other events
The GitOps Flow
Everything is managed via ArgoCD:
argocd-apps/
├── grafana-notifications.yaml  → ContactPoint, NotificationPolicy
├── monitoring-alerts.yaml      → RuleGroups
└── crossplane-providers.yaml   → Grafana provider

manifests/
├── grafana-discord-notification.yaml
├── alert-rules-blackbox.yaml
├── alert-rules-kubernetes.yaml
├── alert-rules-istio.yaml
├── alert-rules-logs.yaml
└── alert-rules-ztunnel.yaml
Change an alert rule, commit, push. ArgoCD syncs it. Grafana picks it up. No clicking through UIs.
What Makes a Good Homelab Alert?
After iterating on this setup, here's what I've learned:
Good Alerts
Actionable: "Registry is down" → I can fix that Specific: "PVC 80% full on postgres namespace" → I know where to look Timely: 2-5 minute thresholds for critical services
Bad Alerts
Too noisy: "Any pod restarted" → Pods restart, it's fine Too vague: "Something is wrong" → What am I supposed to do? Too slow: 30 minute threshold for availability → I'd notice manually first
My Keep List
After pruning noise, these alerts actually matter:
| Alert | Why It Matters |
|---|---|
| Registry Unavailable | Can't pull images for deployments |
| ArgoCD Unavailable | GitOps breaks |
| Grafana Unavailable | Can't see what's broken |
| Ztunnel Certificate Issues | Mesh-wide outage |
| PVC > 80% | Databases will fail |
| Critical Log Patterns | Panic/fatal means something bad |
Everything else is "nice to know" that I check in dashboards, not alerts.
Future Improvements
Better runbooks: My runbook_url annotations mostly point to empty pages. I should actually write them.
Smarter grouping: Some alerts are related (if the VM is down, everything is down). I should group these better.
SLO-based alerts: Instead of "is it up?", alert on "is it meeting its error budget?" That requires more setup.
PagerDuty for critical: Discord is fine, but critical alerts should probably escalate to something that won't let me ignore them.
Wrapping Up
The full observability stack:
- LGTM: All-in-one backend for metrics, logs, traces
- k8s-monitoring: Cluster-wide collection with Alloy
- Service exporters: Kafka, PostgreSQL, Redis, MinIO metrics
- Blackbox: External availability monitoring
- Istio tracing: Automatic distributed traces
- Grafana alerting: Unified alerts with Crossplane management
- Discord: Notifications that reach my phone
Is it overengineered for a homelab? Maybe. But I've learned a ton about modern observability patterns, and when something breaks at 2am, I know about it without watching dashboards.
The key insight: observability isn't about tools, it's about answering questions. Can I quickly determine if something is broken? Can I find out why? Can I know about it before users do?
With this stack, the answer is yes to all three.
This concludes the 4-part series on homelab observability. Thanks for reading!